
Why You’re Not Done Setting Up Google Analytics 4 After Your Data Stream is Receiving Website Traffic
You’ve installed Google Analytics 4 (GA4) and your Admin → Property Settings → Data Streams view looks like this:
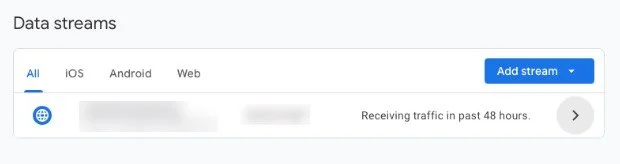
You may be popping champagne at this point, but there’s more to set up. Don’t worry, though: you can make the following additional updates at your own pace. And each step you complete gets you closer to establishing a robust GA4 account – known as a property for each website and/or app – that will provide you with accurate data that matters to your business in just a few clicks after you log back in.
Here are the additional GA4 setup steps we recommend:
1. Turn on Enhanced Measurement in order to see all visitor actions on pages, like views, scrolls, clicks, video engagement, file downloads, and more. Here’s a how-to video for this:
2. Set up IP address blocking so that internal traffic – from your staff and contractors – is excluded from your reports. How-to video:
3. Reports: if you’re not seeing the Engagement section, you won’t be able to access the “Pages and Screens” and “Events” reports. To show the Engagement section under the Life Cycle collection of reports, follow this guidance from this Reddit post:
a. First, double-check if you’re in the right section: Reports → Life cycle → Engagement. Google sometimes moves things around, so it might just look different than before.
b. If it’s really missing, go to Library → Reports → Life cycle collection and see if the Engagement tab is unpublished – sometimes it gets unpinned when GA4 updates. You can just re-publish it and it should reappear.
4. Events report: use Google Tag Manager with GA4 to set up custom conversion event tracking on your website. This allows you to:
a. Track specific clicks, form submissions (eg, newsletter signup, lead magnets), and file downloads – per site (e.g., top menu and/or footer menu) and/or per specific landing page
b. Track how high-ticket pages perform vs. low-ticket pages for edits consideration on high-ticket pages
c. Perform real-time testing on page forms where you may have changed strategies and/or staffing since they were first published, to ensure that no client/customer intake flows are broken
We can help you with this – learn more here.
5. If you’ve set up Google Search Console, connect it to GA4. How-to video:
6. If you currently run Google ads (including YouTube ads) – or plan to – connect Google Ads to GA4. How-to video:
7. Run and save your first report: Total Users by Traffic Source. This allows you to get a high level view of all the traffic sources sending visits to your website. Steps:
a. Click on Library at the bottom left of the screen
b. At the top of the Reports section, click the blue Create new report button. Select “Create detail report”.
c. Select “Blank” at the top of the screen
d. Click the Dimensions dropdown below “Customize report”
e. In the field, type “first user” and select the “first user source / medium” option
f. Click Apply
g. Click the Metrics dropdown below “Customize report”
h. In the field, type “total” and select the “Total users” option
i. Click Apply
j. Click the blue Save… button at the top and name your report. Then click Save.
k. When you want to pull up this report again, you’ll find it under the Library section where you started this set of steps
l. To update the date range for this report – for example, if you’re running this report monthly – select a stock report in the Reports area on the left, update the date range for your preferred range, and then open your saved report in the Library section. Your custom report will update with the new date range you just selected for the previous stock report.
8. Run a second report to track traffic sources for specific pages, such as your highest-ticket pages. Steps:
a. In the Reports section, click on Life Cycle → Engagement → Pages and screens
b. Adjust the date range if needed in the top right corner of the screen
c. If you know the URL you want to look at, type it in the search bar that’s marked by a magnifying glass icon. (This is left of the “Rows per page” setting on the top right of the report.) Then hit Enter.
d. Now you will only see one row in the report corresponding to the URL you want to track. Next, click the blue “+” sign that is next to the “Page path and screen class” column header.
e. Select Traffic source on the left, and then select Cross-channel under the Session-scoped area, then select Session source / medium
f. If you have a lot of source results and you want to see them all on one page, change the “Rows per page” setting on the top right so that it includes all the “1-X of X” results shown at the top right of the report view
g. From here, you can share this report using the share icon at the top right, and/or add the report to your Library by clicking the pencil icon (“Customize report” option) and then clicking the blue Save… button at the top right
We hope these tips are useful to you. If you’d like to get even more out of GA4 – including sending your data to a custom dashboard to avoid extra time navigating GA4 – reach out to us. We’re here to help!