
Using and Maximizing Looker Studio
Here is how you can use Looker Studio and make the most of it in order to know how your marketing is performing at a glance.
We use Looker Studio to build custom data dashboards for our clients, including clients of marketing agencies, because it’s fast, robust, and because it’s a Google product. Since many of our clients have data coming in from Google Analytics and other Google tools, like Google Ads and Google Search Console, Looker Studio makes it easy to display, blend, and translate complex data into simple cards and graphs that let you know how your business is doing in real time.
If you have data coming in from non-Google sources, like Bing, Facebook, Shopify, Klaviyo, email platforms like Mailchimp, or CRMs like SEMRush, we can also accommodate you with a great-looking, automated dashboard.
It’s also super easy to share Looker reports as PDFs so everyone on your team can get the latest reports, without needing to have Looker Studio access.
How to Access Your Looker Studio Report (Dashboard)
If you have access to Looker Studio, you’ll find the homepage at lookerstudio.google.com. From here, you can use the Search bar at the top of the page to find the report you’re looking for.
There’s also a handy area at the bottom of the page that shows your most recent reports. So you can open reports there with only one click.
Another thing our clients do is bookmark Looker report links when we send them. If you lose yours, just reach out to us and we’ll resend it.
How to Access and Change the Date Range
Once you have your Looker report open, one of the first things many of our clients do with it is to update it for a desired, recent date range. One of our SOPs when building dashboards is to add a handy date range widget at the top-right of all pages in the report. We usually set it to show the last 28 days of performance, but you can click on it to set the range you want. (And we can set it up to show a different date range by default if you need.)
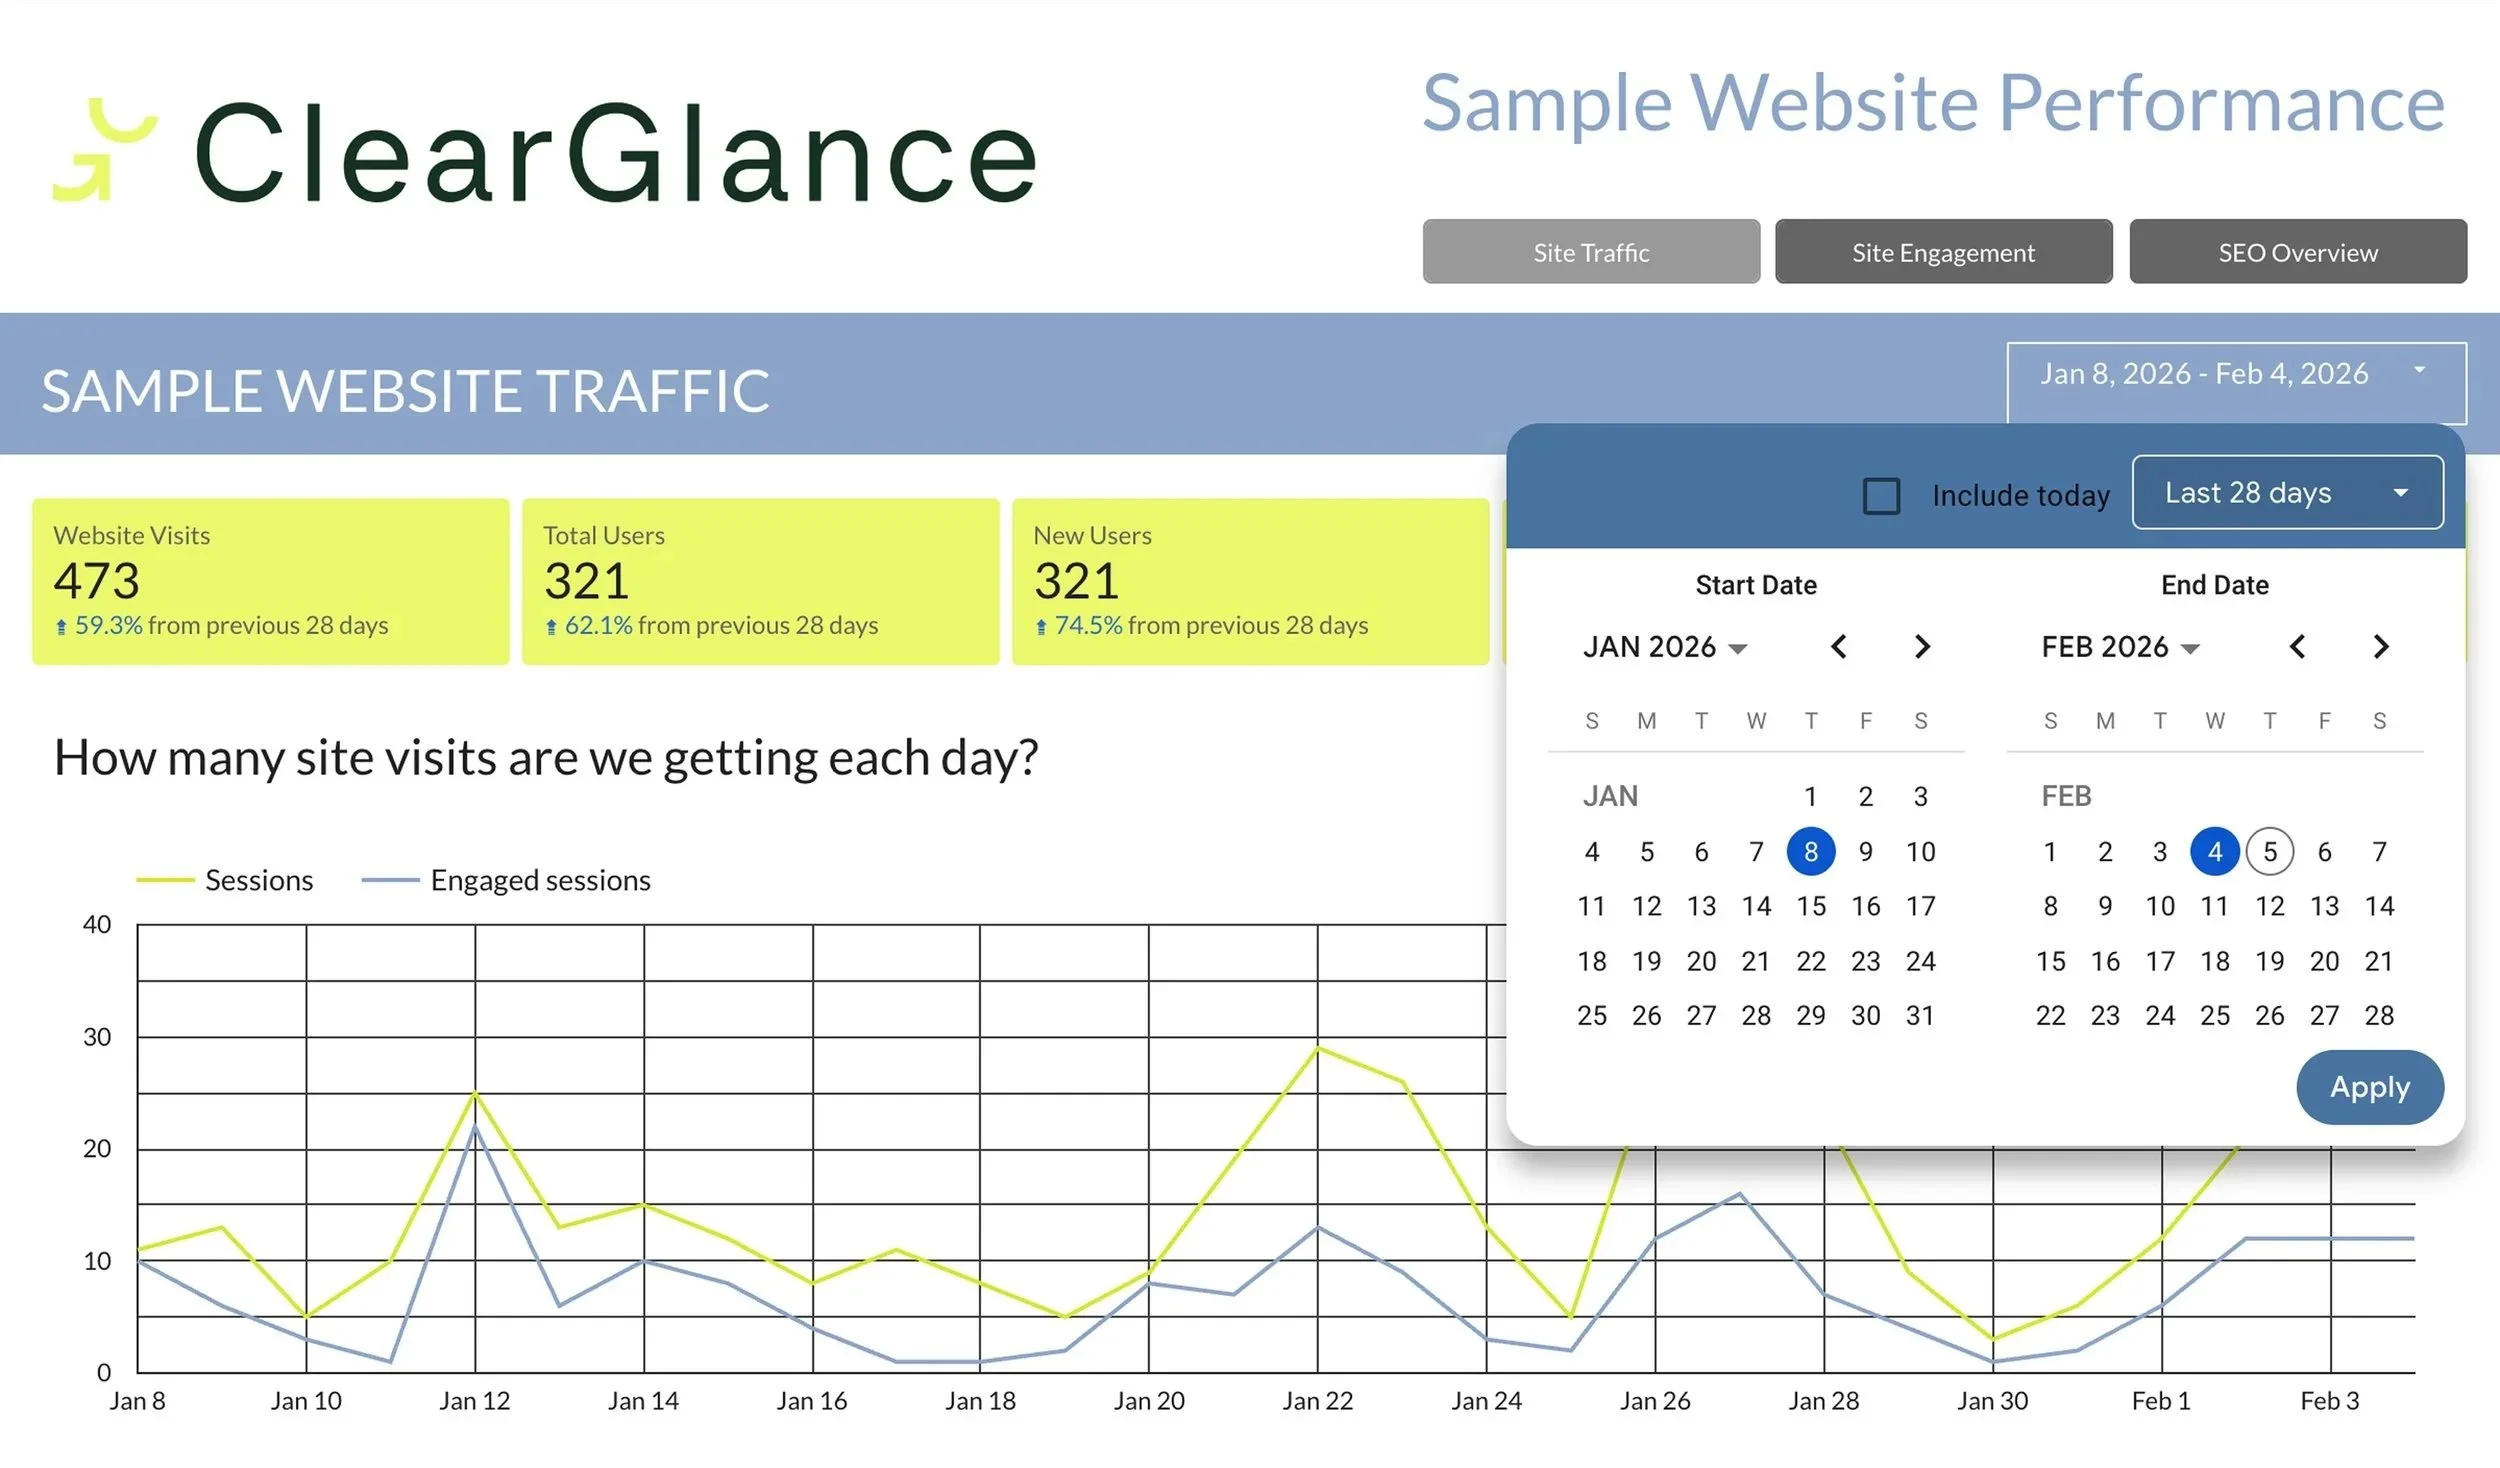
We can also set up your report with the date range widget at the bottom of every page, and so that, if you change it to a different range, it will stay that way while you open other pages in the report.
How to Use Filters
The next important thing to know about navigating your Looker report pages is how to use the filters that you’ll see just above some of the graphs. We can add one or even multiple filters that connect to specific graphs on the page. Having multiple filters in place is helpful for tables that show more than one dimension, like a table on New User sources that has columns for Marketing Channel, Source, and Campaign.
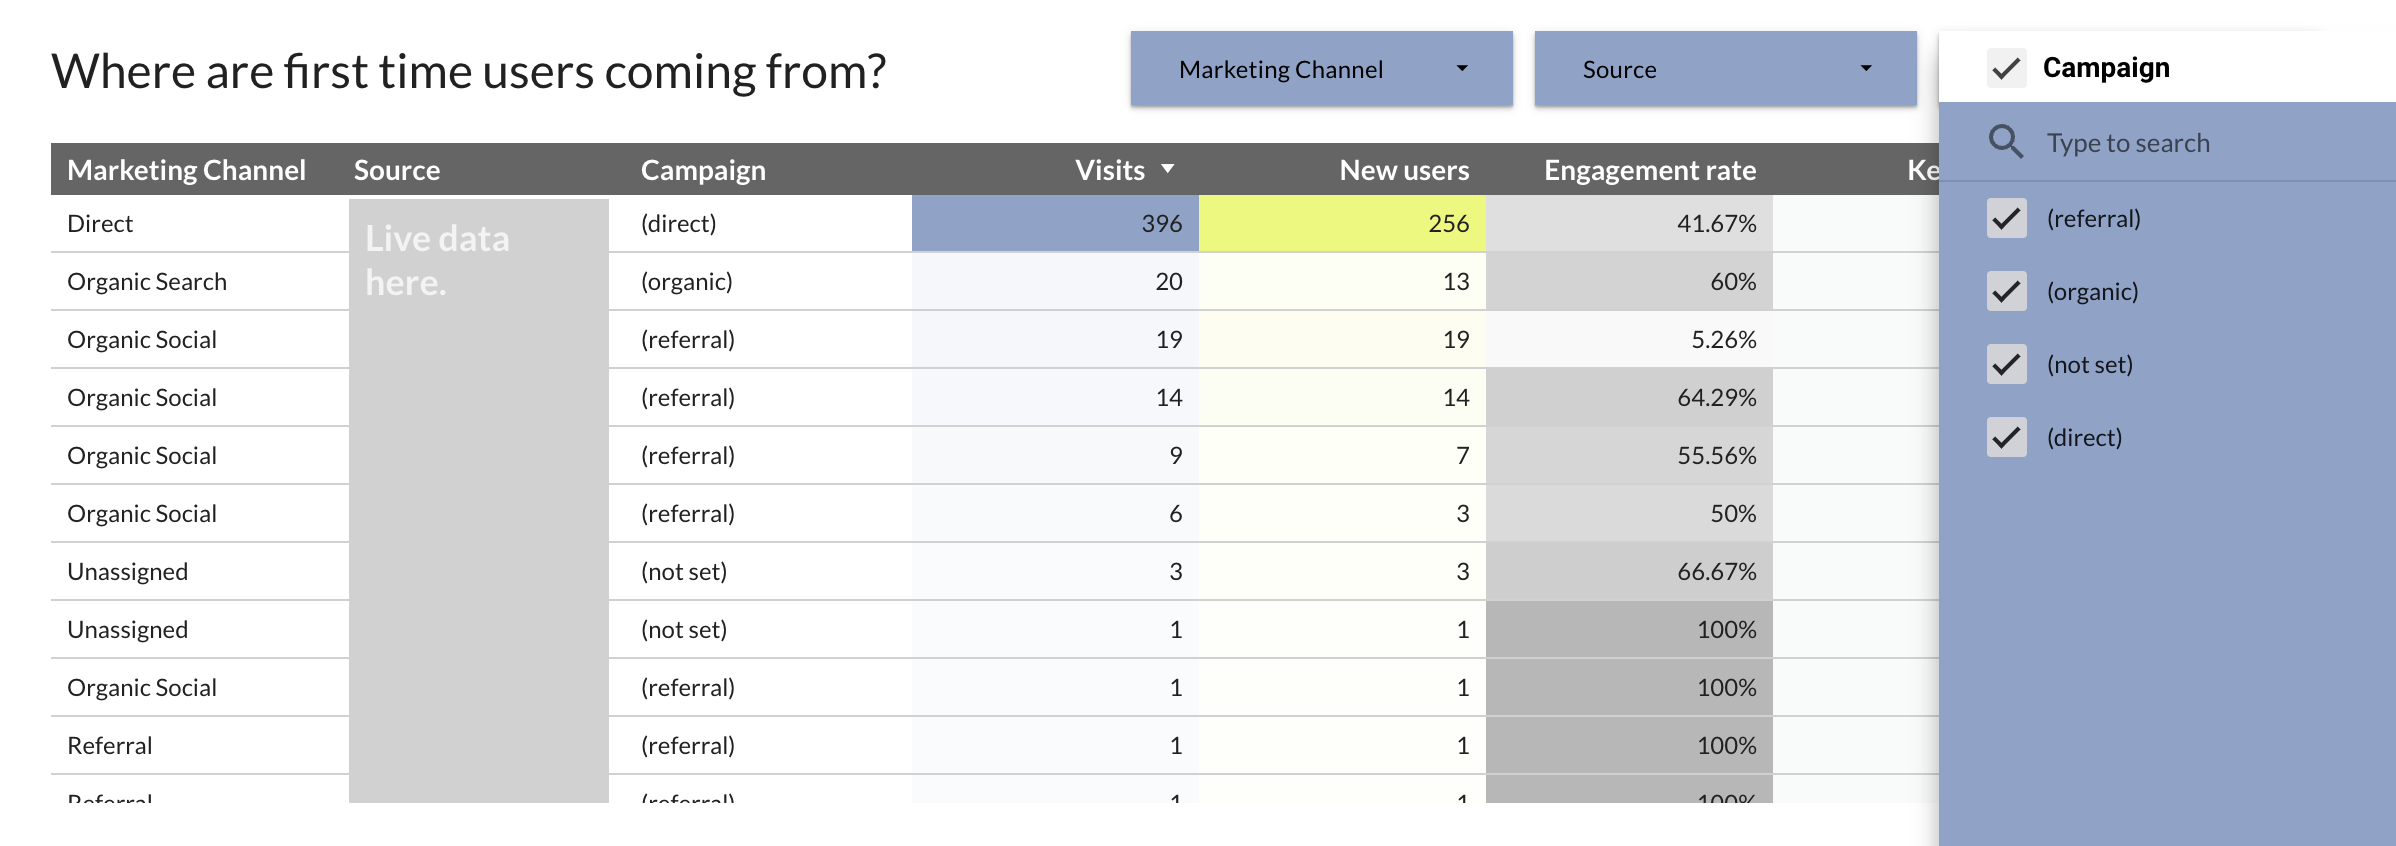
In an example like this, you can drill down to look at the Paid Social visits that drove Sessions and New Users, and also see the Engagement Rate and Conversions from each paid social channel. We can work with you to set filters to update ALL the graphs on a page, or only one or certain ones. It’s very easy to drill down to look at only one Marketing Channel, Source, or Campaign.
How to Read the Data
At ClearGlance, we start with your questions. For example, many clients want to know:
What are the top actions users are taking on my website?
Where are first-time users coming from?
Where are my users located?
What devices are most popular?
How do my users break down for gender and age range?
What content is most engaging?
And what content leads to conversions?
We make the answers to questions like these easy to find. You’ll have a Table of Contents view on the left that you can use to navigate to the page you want, which usually translates to your Marketing Channels, like Website Traffic, Organic Traffic, Paid Search, Paid Social, User Behaviour, or User Details.
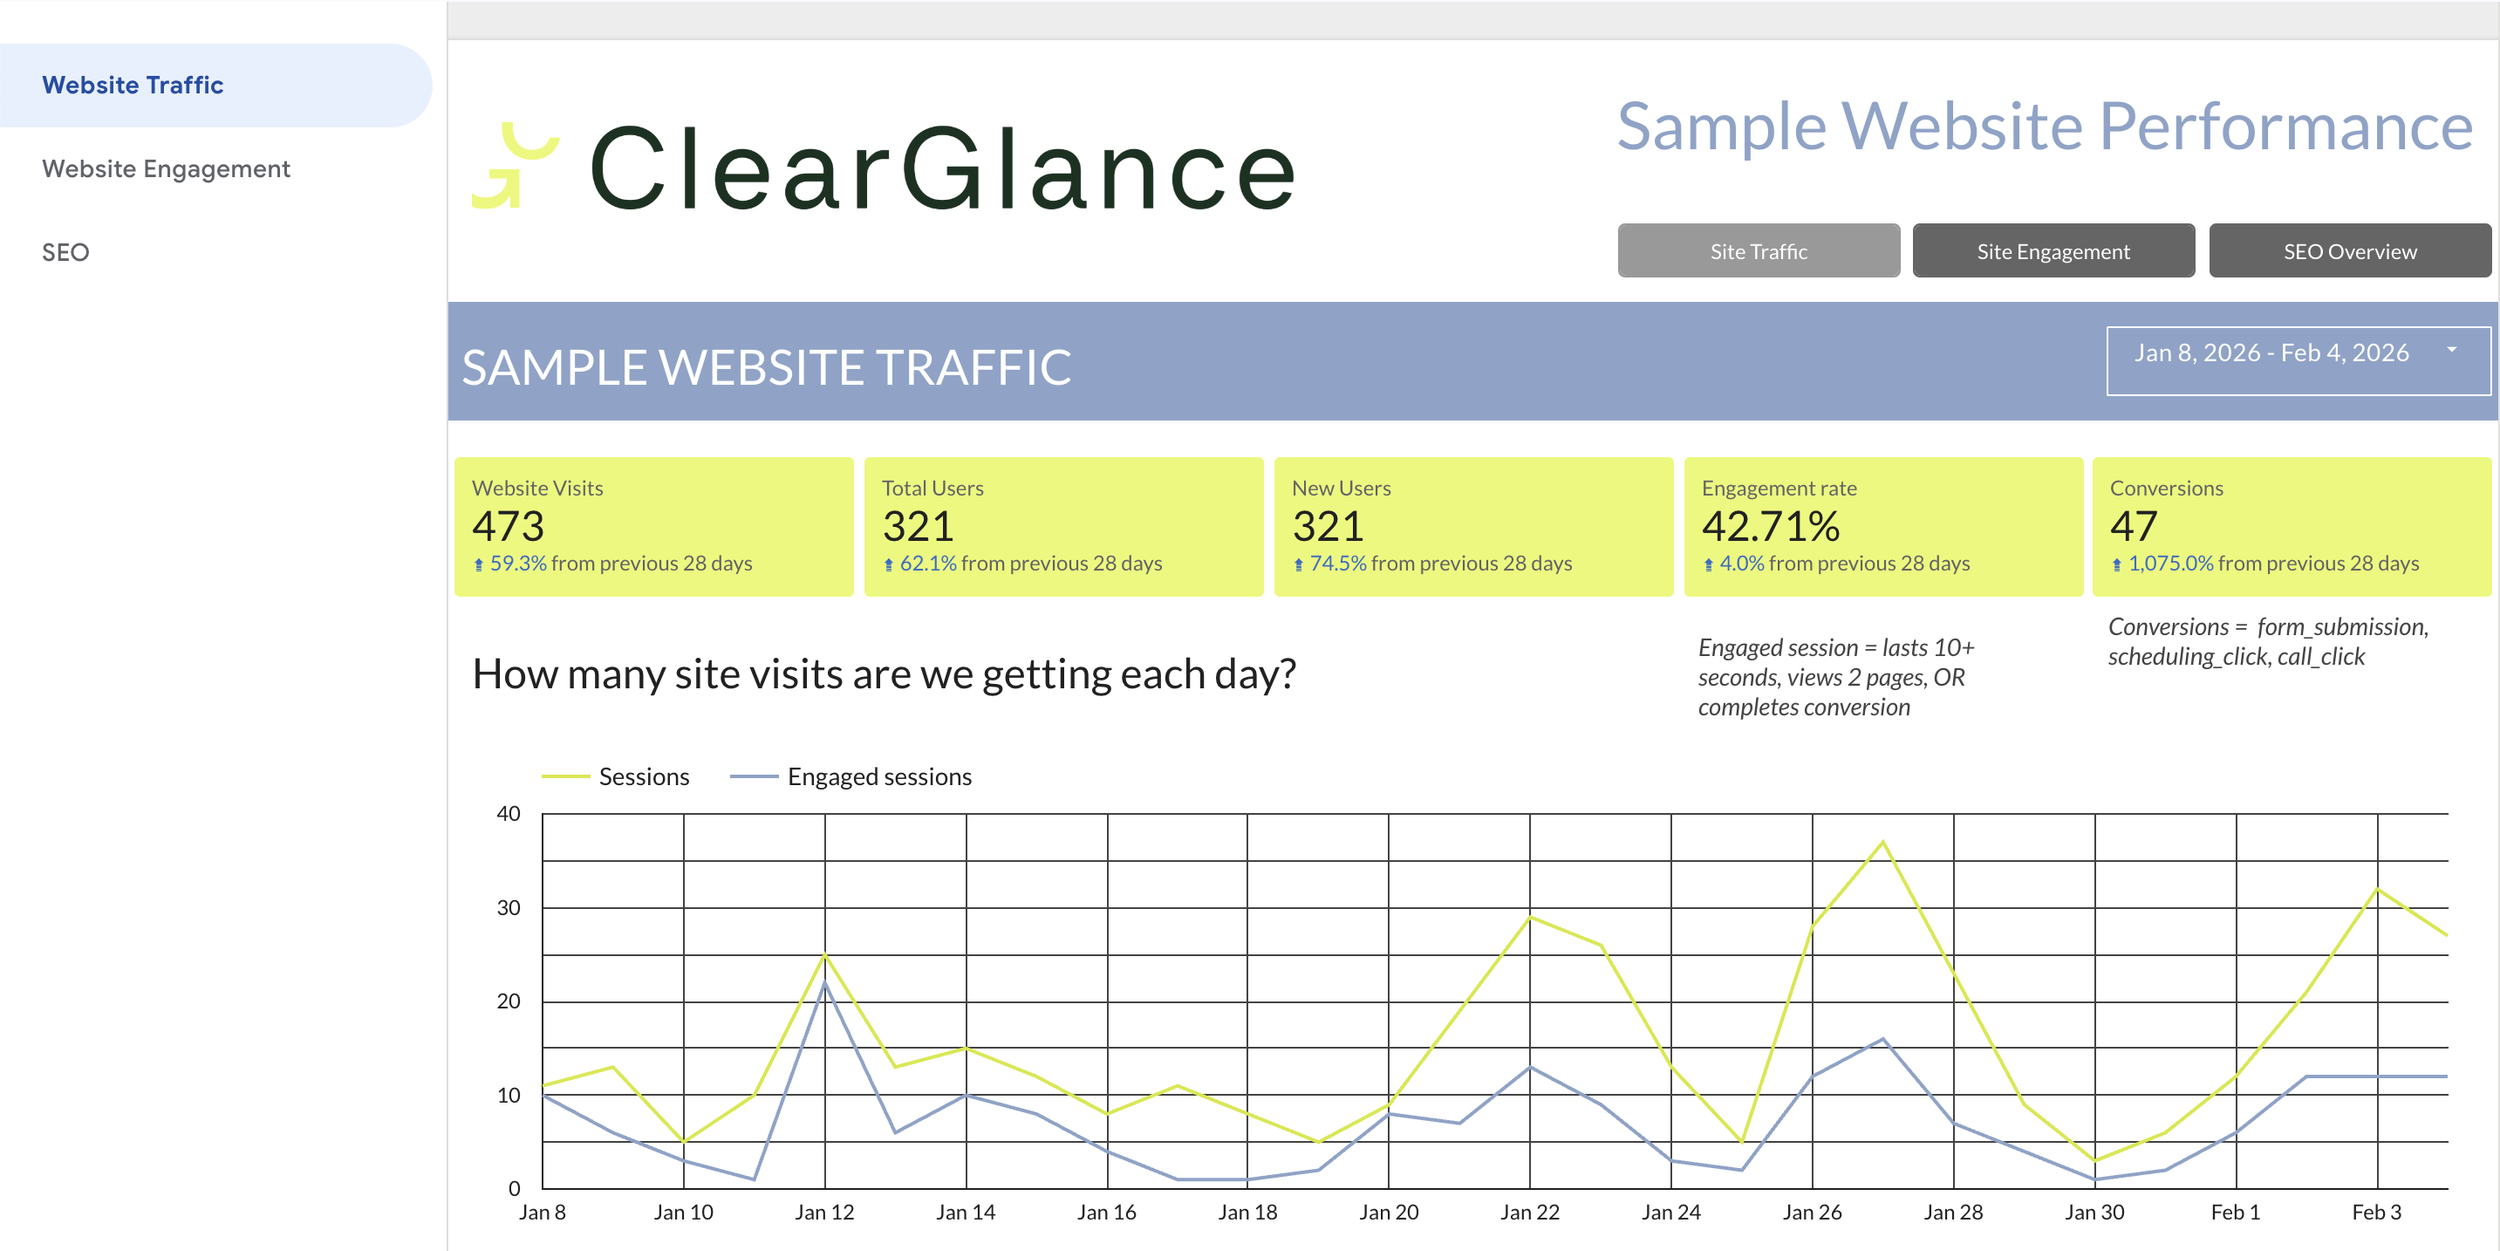
From there, you can jump to the question on the page that’s being answered with trusted, real-time data.
A Custom Dashboard Saves You Time and Headaches
If you want to shift the time you’re spending on hunting down recent data from multiple data sources, over to strategy, business development, or other, higher-value tasks, let’s talk. We can help you make that shift a reality with a custom dashboard that pulls in data from all your sources, allowing you to quickly make sense of what’s happening with your marketing. We can also update your dashboards that are broken and not serving you.
We hope this peek into the power of Looker Studio is helpful. If you have any questions, let us know. We’re here to help!